Xdebug - Debugger Tool for PHP
Xdebug is an extension for PHP, and provides a range of features to improve the PHP development experience.
Scaffold comes with Xdebug pre-installed and configured for local development thanks to Lagoon images.
Xdebug is also configured to work in coverage mode, allowing to run tests with code coverage enabled. See PHPUnit for more details.
Usage
Xdebug is disabled by default.
XDEBUG_ENABLE=true docker compose up -d cli php nginx   # Restart containers with Xdebug enabled.
docker compose up -d cli php nginx                      # Restart containers with Xdebug disabled.
or
ahoy debug-on  # Restart containers with Xdebug enabled.
ahoy up        # Restart containers with Xdebug disabled.
IDE configuration
PhpStorm
By default, PhpStorm is configured to automatically interrupt on incoming
unmapped debug connections when Start listening for PHP Debug Connections
button (the one with a little bug) is activated. When interrupted, PhpStorm
will ask you to map the incoming connection to a project.
In order to use Xdebug on the project for the first time, you need to follow these steps (assuming you already have a fully working site):
-
Install Xdebug helper extension for your browser:
- Chrome Xdebug Helper extension.
- Firefox Xdebug Helper extension.
- Edge Xdebug Helper add-on.
-
Enable Xdebug in your browser (see instructions for your extension/add-on).
-
Set a breakpoint in your IDE.
index.phpin your web root is a good place to start. -
Run
ahoy debugorXDEBUG_ENABLE=true docker compose up -d cli php nginxto enable Xdebug. -
Refresh the page in your browser.
-
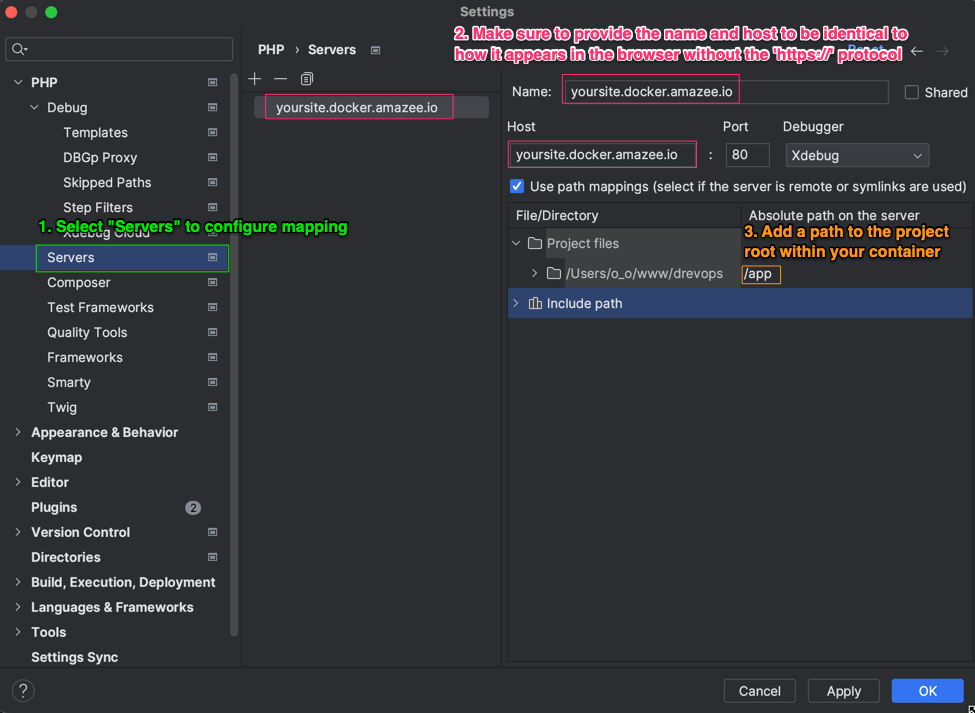
PhpStorm will stop on your breakpoint and will ask you to map the incoming connection to directory in your project. This is because the code runs in the container, which qualifies as a remote server. You need to "tell" Xdebug where to find the code on your local machine that corresponds to the code running in the container. You would need to do it once and PhpStorm will remember the mapping.
For more information see the following resources:
- https://www.jetbrains.com/help/phpstorm/configuring-xdebug.html#debugging-with-phpstorm
- https://docs.lagoon.sh/using-lagoon-advanced/setting-up-xdebug-with-lagoon/
Tips and tricks
Once your first Xdebug session is set up, you can adjust some of the Debug configurations in the PhpStorm IDE to make your life easier:
- Disable the following options:
Break at first line in PHP scriptsForce break at first line when no path mapping specifiedForce break at first line when a script is outside the project
- Increase the number in
Max. simultaneous connectionsto5or more. This will prevent hidden debug session being "stuck" without being visible in the IDE.
Running PHP from the command line with Xdebug works the same way as debugging a web page, except that you need to run it from within the container.